
Pathpoint eDerma Analytics Dashboard
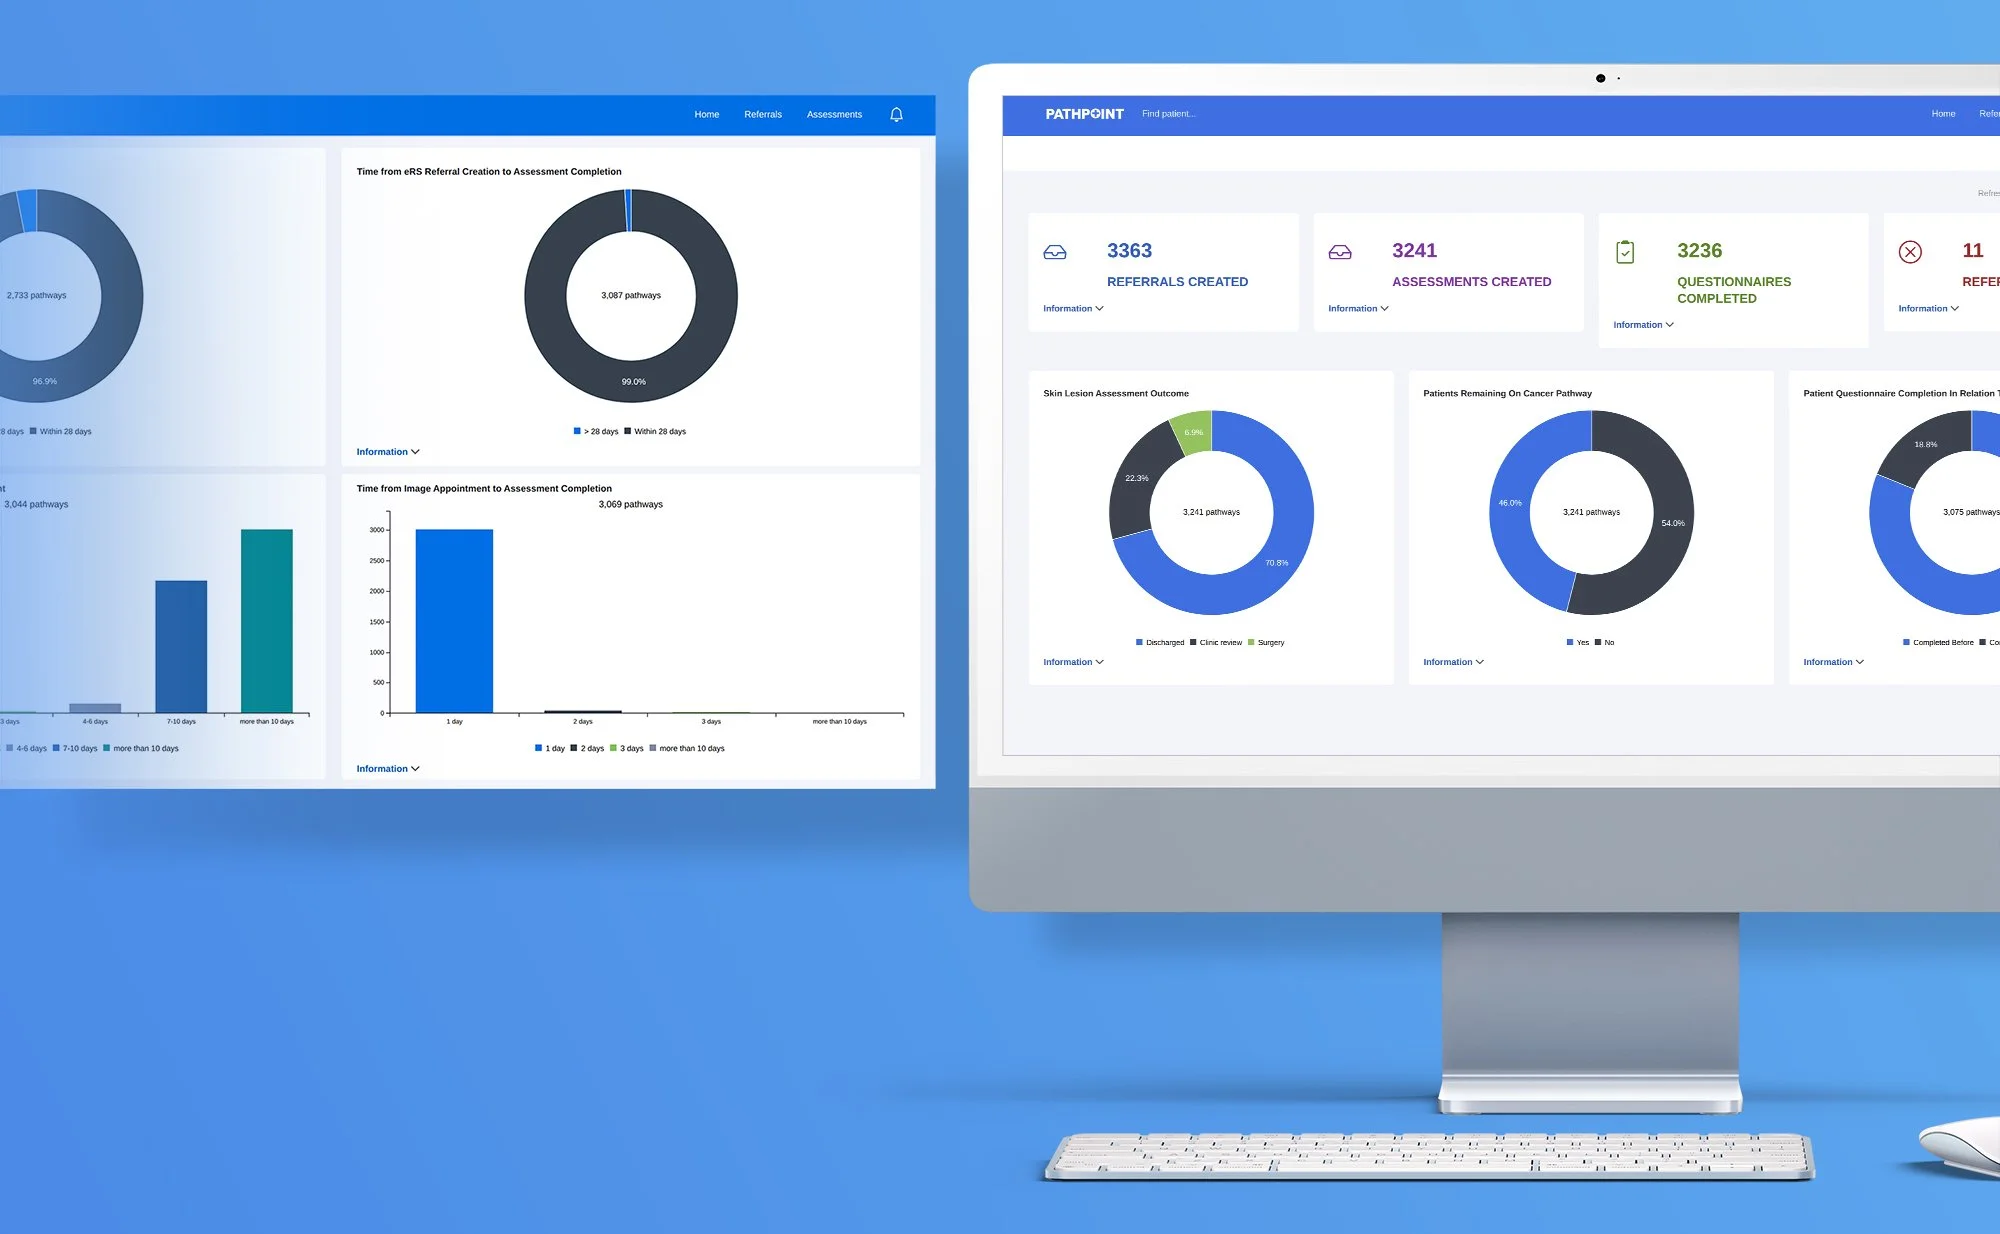
1. Top-Line Summary Cards
Located at the top of the dashboard, four core metric cards deliver immediate visibility into pathway volume covering the last 6 months:
Referrals Created: Displays the total count of skin lesion referrals received in the platform.
Assessments Created: Displays the total count of skin lesion assessments created.
Questionnaires Completed: Displays the total count of completed teledermatology digital screening questionnaires.
Referrals Rejected: Displays the total count of rejected skin lesion referrals.
2. Clinical Outcomes & Patient Engagement
This section uses intuitive donut charts to summarise where patients go after their assessment and how well they engage with digital questionnaires:
Skin Lesion Assessment Outcome: Shows the proportion of assessment pathways resulting in Discharged, Clinic review, or Surgery.
Patients Remaining On Cancer Pathway: Shows the percentage of pathways where the patient remains on an active cancer pathway (Yes vs. No).
Patient Questionnaire Completion In Relation To Image Appointment: Shows the breakdown of digital screening questionnaires Completed Before vs. Completed On the day of the imaging appointment. This serves as a proxy metric for patient engagement - questionnaires should ideally be completed prior to their imaging appointment.
3. Compliance & Turnaround Times
Four targeted charts allow monitoring of service performance against targets and identification of pathway bottlenecks:
FDS Compliance (28 days): Shows the percentage of referrals meeting the Faster Diagnosis Standard target within 28 days (calculated from eRS referral creation to the "Patient Letter Sent" date).
Time from eRS Referral Creation to Assessment Completion: Shows the proportion of referrals assessed within 28 days vs. taking longer than 28 days.
Time from eRS Referral Creation to Image Appointment: A bar chart breaking down the days elapsed between eRS referral creation and the image appointment (1 day, 2 days, 3 days, 4–6 days, 7–10 days, and more than 10 days).
Time from Image Appointment to Assessment Completion: A bar chart showing how many days it took to complete the assessment after the image appointment (1 day, 2 days, 3 days, 4–6 days, 7–10 days, and more than 10 days).
4. Referral Volume Trends
Bar charts offer clear time-series visualisation to help manage capacity planning:
Number of Skin Lesion Referrals Created by Week and Category: Displays weekly referral counts over the 6-month period, filtered by category.
Number of Skin Lesion Referrals Created by Month: Displays total monthly referral volumes across the 6-month period.
5. Follow-Up Breakdown
For patients requiring face-to-face review, this section provides detailed insights into clinical rationale:
Follow-up Clinic: Shows the volume of pathways referred to specific follow-up clinics.
Follow-up Timing: Breaks down the required timing for the follow-up appointment.
Reasons for Clinic Review: A multiselect bar chart detailing the specific clinical or technical reasons a clinic review was booked, including (but not restricted to):
Quality of visual image
History not obtained
Conservative therapy
Multiple lesions
Further assessment required
Uncertain diagnosis